 |
Department of Radiation Oncology |
 |
|
Department of Radiation Oncology |
|
| RETURN TO JOHN SOKOL'S HOME PAGE |
Peter Tarczy-Hornoch, Eric R.. Lee, John L. Sokol,
Stavros D. Prionas, Allen W. Lohrbach, and Daniel S. Kapp
Dept. Radiation Oncology
Stanford University
Stanford California 94305, USA.
Reprint requests to:
Acknowledgments:Daniel S. Kapp, M.D., Ph.D.
Department of Radiation Oncology
Stanford University School of Medicine
Stanford CA 94305
ABSTRACT
In order to better assess temperature distribution
patterns in tissue equivalent phantoms, experimental animals and patients,
mechanical devices and automated control systems for positioning temperature
probes in implanted catheters and catheters laid on the skin surface have
been developed. These Systems had to be designed to be compatible with
the thermometry and heating devices associated with the ultrasound (US),
radiative electromagnetic (EM), or radiofrequency current (RF) modalities
utilized in the phantom, animal model and patient studies. They all employ
stepper motor actuated roller and idler wheel drives to move the probes.
Two devices incorporate positive positioners in addition to the drive rollers
in order to obtain higher positioning accuracy while significant probe
to catheter friction is present. Automated systems have been constructed
which can simultaneously position, record and display data from up to ten
temperature sensors within their catheters. The software developed for
these multiprobe mappers displays the data obtained in a color coded position
versus temperature format to produce a real time two-dimensional color
code pseudo isotherm display that correlates well with images taken with
an infrared thermographic camera. The thermal mapping devices have been
used for characterizing the power deposition patterns of several large
area microwave applicators (on the surface and at depth within tissue equivalent
phantoms), for intraorgan temperature mapping in experimental animals,
and for surface and subcutaneous temperature mapping during clinical treatments.
Key words: Hyperthermia, thermometry, thermography, scanned thermometry,
microcomputer
1. INTRODUCTION
The ultimate goal for the thermometry engineer working in clinical hyperthermia is to develop a non-invasive three dimensional method with a spatial resolution of 5 - 10 mm3, temperature accuracy and resolution of 0.1 - 0.2 °C , and a temporal resolution of less than 1 second (Cetas et al.1978, Christensen 1979, 1983, Hand 1987, Shrivastava et al.1988, Kapp et al.1988.) This goal remains elusive although progress is being made (Tanaka et al. 1981, Christensen 1983, Prionas and Hahn 1985, plancot et al.1987). Presently, temperature sensors placed on the skin surface and inside invasively placed catheters within the treatment volume are the only reliable means available for acquiring detailed thermometry data. Manual mapping of various types of temperature sensors through phantoms, animal and human tissues has been employed in order to characterize temperature distributions during treatments and to determine applicator specific absorption rate (SAR) patterns (Kopecky 1980, Christensen 1979, Fessenden et al. 1984, Oleson et al.1985, Hand 1987). Furthermore, since 1983, various custom built automatic and semi-automatic temperature mapping systems with one or more mapped temperature sensors have been designed and utilized, (Gibbs 1983, Engler et al. 1987), with one system commercially available1. At Stanford, the development of scanned and mechanically static microwave array applicators for treating large superficially located tumors (Samulski et al. 1990, Lee et al. 1991) has produced a need to maximize the amount of thermometry data obtainable from the relatively small number of highly expensive microwave compatible probes available within existing data acquisition systems. Commercially available thermometry equipment is inadequate in terms of its ability to provide at a reasonable cost, the thermometry information needed to properly control these applicators. One method of increasing the amount of accessible temperature data is by spatially multiplexing the available thermometry by automatically scanning single and groups of sensors through catheters placed within the treatment field. Four probe positioning devices with different performance capabilities and operating software have been constructed and tested in both research and clinical environments to explore the practical limits of mechanically scanned thermometry. Two of the devices are operated as conventional single sensor positioning devices for measuring thermal profiles along an implanted catheter. They have unique mechanical features different from other devices previously described in the literature. Two other devices were designed to map parallel arrays of temperature sensors with a single positioning device in order to acquire larqe amounts of thermometry data. The clinical and experimental use of these parallel catheter array mapping devices required special software to effectively display the large amounts of data acquired. The use of these mapped arrays for obtaining experimental data and for providing a grid of surface thermometry points to aid in the controlling of hyperthermia applicators will be described in detail.
1. BSD Medical corporation, Salt Lake City,
Utah 84108, U.S.A.
2. METHODS AND MATERIALS
2.1. Mechanical Descrptions:
2.1.1. Device 1 - Single sensor miniature mapping device
Device 1 (figures 1(a) and 1(b))
is a probe mapping device designed to remotely position a single temperature
sensor for use in hyperthermia treatments administered to superficially
located (<3 cm depth) tumors. Existing designs for probe mapping devices
have.been reported to damage probes in situations where the catheter becomes
obstructed or compressed. The hyperthermia clinical staff specified that
a mapping device for use during surface treatments should be small, light,
nondestructive of probes and allow rapid probe insertion and extraction.
Device 1, designed to satisfy these design criteria, weighs 110 grains
and has a maximum linear dimension of 5.5 cm. The probe to be mapped is
held between a rubberized cylinder attached to the shaft of an 18 steps/rotation
stepper motor and a spring loaded steel idler wheel on a ball bearing shaft.
The rotation of the stepper motor is converted to linear motion of the
temperature sensor by the rotation of this rubberized drive cylinder. A
spring loaded pivot on the idler wheel mounting arm allows the clinician
to rapidly disengage the rollers to insert or remove the temperature probe.
Since the probe is driven with a controlled amount of friction, an obstructed
catheter will cause positional stalling but not probe damage. This mapping
device was originally designed to have either a clip or a piece of tape
attached to the probe lead to act as a position marker and mechanical stop.
Initiating a small number of redundant motor steps after this stop comes
into contact with the reference plate serves to rezero the probe to a known
point and eliminate any cumulative map to map positioning errors. This
reference plate and marker also allows the clinician to easily verify the
current position of the probe. In practice, position referencing the stop
point by allowing the probe to be driven into the catheter until the tip
of the probe met with the end of the catheter functioned equally well.
2.1.2. Device 2 - Friction driven multiprobe mapping device
Device 2 (figures 2(a) and 2(b)) is similar in principle of operation to Device 1 but has been constructed to allow up to eight temperature sensors to be driven simu1taneously. The mechanical portion of the thermometry scanning system that controls probe motion is actuated by a single stepper motor. This drives a rubberized shaft which relies on friction to linearly translate the thermometry probes. A total of up to eight probes can be used simultaneously. A spring loaded idler wheel drive holds each probe firmly against the drive shaft. The absence of a rigid mechanical contact between the driving mechanism and the probes simplifies change-over between different probe types. In event that the probes encounter significant resistance to translation, the friction drive permits slippage rather than potentially destroying the probes by forcing them against resistance. During each scan cycle the motor drives the probes to a predetermined start position. At this location the probe limit stop (figure 2(a)) automatically mechanically realigns them, thereby eliminating cumulative positional error. The entire device weighs 1.5 kg and measures 8x8x24 cm.
The 60 cm long integral guide tubes used for alignment of the probes beyond the drive shaft (figure 2(a)) are modified 19 gauge Deseret2 catheters. The ends are flared to fit into other Deseret catheters, which can be placed interstitially, singly on the surface or mounted on the surface in parallel groups to form a mapping sheet. These catheters are held together by frictional coupling or tape.
To simplify setting up surface thermosetry a set of interchangeable mapping sheets have been constructed from transparent vinyl sheet (0.0005 cm thick) on which are fixed an array of flexible catheters. A centimeter spaced grid is marked on the vinyl to serve as a reference coordinate system. The catheters are placed at fixed spacings laterally. The lateral separation of the catheters for a given microwave applicator were chosen to ensure adequate coverage of the heated area.
2. Deseret Medical, Inc., Sandy, Utah 84070, U.S.A.
2.1.3. Device 3
Device 3 (figures 3(a) and 3(b))
is an improved version of Device 2 that incorporates a positive positioning
device. In Device 3 this consists of a stepper motor driven rotating cylinder
around which are wound the temperature probes to be scanned. This rotating
cylinder limits the maximum outwards travel of the temperature probes and
provides the primary withdrawal force for pulling the probe from the catheter.
The principle advantage of adding this positive positioning device is the
ability to accurately position the probes under conditions where there
is appreciable friction between the probes and the catheters. The roller
and idler wheels provide the motive drive for insertion of the probe into
the catheter utilizing a preset number of redundant rotations per move
to insure proper positioning. In order to optimally drive Teflon sheathed
thermocouple probes, different conbinations of roller and idler wheel materials
were investigated. A roller and idler wheel combinations consisting of
a tyqon sheathed drive roller combined with a grooved aluminum roller provided
the best combination of drive friction and controlled slip. The probe sparing
property of Device 1 and Device 2 when catheter blockage occurs is retained.
Luer-LokTM connectors are used to interface the mapping driver
hardware to the thermometry catheters. These connectors allow rapid connection
and disconnection of the mapping device to the catheters while retaining
positive and repeatable position referencing. The effective positioning
speed of this device is approximately 20 cm/sec or 5 times that of Device
2.
2.1.4. Device 4 - Friction driven multiprobe mapping device utilizing linearly sliding platforms for positive positioning
Device 4 (figures 4(a) and 4(b))
is similar to Device 3 in principle of operation except that a linear slide
driven by a lead screw is used as the positioninq system, and a quick release
friction clamp is used for retention. This permits the probe(s) to be rapidly
changed in and out of the mapping unit for ease of routine maintenance,
and to allow rapidly switching probe types (i.e. E-field, temperature)
into the same catheter during an investigational study or a treatment.
Two independently positionable linear slides control the probe positions.
Each slide can clamp up to 4 probes. A common set of roller and idler cylinders
furnishes the drive for both slides. The overdrive factor for the drive
rollers is set to be adequate for the slide executing the longest move.
Ease of probe exchange and the ability to independently position sets of
probes were the design enhancement Device 4 was intended to implement over
Device 3.
2.2. Electronics and software:
2.2.1. Device 1- Single sensor miniature mapping device
Device 1, the miniature single probe rapping device, is directly interfaced to the primary data acquisition system through modifications of the in-house written operating code. The driving electronics passes the stepper motor drive signals through an LC filter network to protect the digital control electronics from the RF interference picked up by the motor and its power cables (figure 5). The stepper motor controller (HiStepperTM)3 is connected to the primary data acquisition system through a standard RS-232 serial link. The temperature maps are printed in real time, formatted as a position versus temperature table. simultaneously, the temperature probe trace is displayed on a temperature versus time plot. This device functions equivalently in basic mode of operation to other temperature probe mapping devices reported in the literature (Gibbs 1983, Engler et al. 1987), though is smaller, lighter, and has a faster set-up time.
3. CyberPak Co., PO Box 38, Brookfield Illinois, 60513,
U.S.A.
2.2.2. Device 2 - Friction driven multiprobe mapping device
Figure 6 is a block diagram of Device 2 set up to function as a 2-dimensional thermal mapping system (2D-TMS). Device 2 was designed to operate in a stand alone system. The hardware consists of a host computer (IBM clone) interfaced to a stepper motor controller and a multi-probe thermometry system. The computer controls the movements of the probes and carrelates their positions with the output of the thermometry device(s) to produce a scaled, color coded 2 dimensional grid of thermometry points. The 2D-TMS was primarily used with a fibre optic based temperature probe system (Luxtron 3000)4 with eight independent sensors (in two groups of tour) on 1 meter long cables. software subroutines were also implemented for reading the BSD Bowman high impedance lead thermistor probes (Bowman 1976). The mechanical positioner has been designed such that it can physically accommodate any small flexible thermometry probe. The operating software is sufficiently flexible to support other thermometry devices.
The software developed to control the 2D-TMS can display temperature data from up to a probes on a two dimensional (X,Y) positional grid ( figure7). The temperature measured by each probe at a given scan position is displayed at the center of a rectangular cell (with 0.1 °C resolution). The software adjusts the aspect ratio of these cells depending on the horizontal spacing between probes and the size of each linear translation to achieve a true 1 to 1 scale representation of temperature versus position (within the constraints of computer monitor resolution and screen size). With potentially up to 15 points per probe there can be up to 120 individual temperature values on the screen at one time. This number of discretely displayed numerical data points is for all practical purposes impossible to read and.interpret in real time (i.e. during the actual hyperthermia treatment). The program therefore allows the user to color code each temperature point by specifying a high and low acceptable surface temperature (e.g. 42.0 °C - 43.5 °C) . The high and low limits are used to divide the range of acceptable therapeutic temperatures into N equal subranges (currently N=3), displayed on the screen as N shades of green. similarly N subranqes are extrapolated at either end of the range and color coded in shades of blue and red to represent cool and hot zones respectively. This, in effect, provides a 2 dimensional low spatial resolution pseudo isotherm display. The computer stores all data parameters tor each point (temperature, position and time) and can reproduce the color coded temperature point grids for subsequent analysis.
Before initiating a hyperthermia treatment session the user can specify the lateral distance between probes, the translation distance (both are used to scale the screen display), the translation speed, the dwell time prior to taking a reading, and the nunber of readings to average. During the session, the user can vary the high and low temperature limits and have the program immediately redisplay the data (<0.1 second) with the new color transition points. During a treatment, and in particular at the end of a treatment, the computer can rapidly acquire temperature data with all probes at a fixed location (thermal "washout" data). This data is also stored on disk for further analysis.
4. Luxtron, 1060 Terra Bella Avenue, Mountain View,
CA 94043,U.S.A.
2.2.3. Device 3 - Friction driven multiprobe mapping device utilizing a rotating cylinder for positive probe positioning
Device 3 is operated from a stand alone system set up to take data using thermocouple probes (figure 8). The controller is an IBM AT compatible computer directly interfaced on the bit level to the stepper motor driver clock and direction lines. This close control of the stepper motors permits optimization of acceleration and deceleration by empirical experimentation in order to maximize stepping rate while retaining accuracy. An experimentally calibrated look up table corrects for the variable teed angle error which occurs just before the maximum insertion point where the cylinder rotates such the probe anchor points on the cylinder are facing the drive rollers. The drive software utilizes two key operating procedures to maximize positioning accuracy. First, all positioning is done in withdrawal mode to eliminate backlash caused by probe compression within the catheter. All probe positioning moves are overdriven past the desired location into the catheter and then are withdrawn to their final position. second, the probes are kept under constant controlled tension during all move operations. The rate of rotation of the roller and idler wheel drive is set such that it either slightly lags or leads the rate of travel of the positioning drum. This maintains a constant tension between the rollers and the positioner set such that the probes are not over stressed. An HP3497A5 operated from an IEEE 488 interface is used to obtain thermometry data. Calibration correction tables are generatable from on board software for different thermocouple probes. The 2-dimensional display and positioning control software is equivalent in capability to that which operates Device 2.
5. Hewlett-Packard Company, 3003 Scott Boulevard, Santa
Clara, California 95054, U.S.A.
2.2.4. Device 4 - Friction driven multiprobe mapping device utilizing linearly sliding platforms for positive positioning
Device 4 was designed to work in conjunction with the commercial BSD 2000 SIGMA 60 deep heating system1. It has an operating and display computer (IBM AT) separate from the BSD control computer. This computer controls the movements of the stepper motors in the mapping device, records the temperatures of the probes being mapped and displays the resultant temperature versus distance maps on a color monitor. Temperature data is acquired by monitoring the Luxtron 3000 thermometry unit, operating under the control of the BSD computer, through the Luxtron 3000 unit's unused printer output port (figure 9). The monitoring of the thermometry data during actual treatments is thus totally transparent to the primary treatment control computer. A commercially manufactured stepper motor driver (Cybot TutorTM robotics control electronics6), connected by a serial interface to the IBM clone control computer operates the three stepper motors actuating the mapping device. A mouse operated graphical user interface is implemented which operates similarly to, but independently of, the screens on the BSD treatment control computer.
1. BSD Medical Corporation, Salt Lake City, Utah 84108,
U.S.A.
6. Cybot, Inc., 12510 128th Avenue NE, B-5, Kirkland,
Washington 98034, U.S.A.
3. EXPERIMENTAL AND CLINICAL EVALUATION:
3.1. Device 1 - Single sensor miniature mapping device
Device 1 was implemented to relieve the hyperthermia technologists performing the surface hyperthermia treatments from the tedious task of manually moving the intracatheter temperature probe(s) and recording by hand the temperatures obtained. The minimum operational requirement was for a device able to position the temperature probes to the order of accuracy that a human operator is able to achieve in a clinical setting. Very rarely is it important to know the exact location of the temperature probe to fractions of a millimeter within a catheter during a patient treatment. What was desired was a large sampling of points along the catheter at regular repeatable intervals in order to assess the general effectiveness of the heating at depth. The clinical staff were insistent that the device be as small and light as possible so that patient movements during the treatment that might displace the catheter and mapper would not dislodge the implanted catheter. It was also considered very iriportant that temperature probe insertion and removal be as rapid as possible to minimize patient set-up time and to allow interchanging probes during a treatment if probe calibration became in question.
Initial tests were done to determine necessary dwell time for probe equilibration after a move, the maximum reliable stepping rate of the positioner, and the precision and absolute accuracy of the positioner. The resolution of the miniature stepper motors used in combination with the diameter of the drive roller limited the absolute positioning accuracy to ±0.75 mm. Repeatability was limited by the amount of friction between the catheter and the probe contained within the catheter.
The mapper was designed to have the probe home against a mechanical stop before the start of each map. All maps were taken in withdrawal mode from the fully inserted position. This was intended to eliminate any potential cumulative map to map error. During initial clinical testing it was discovered however that for the short catheter lengths used for thermometry durinq superficial depth hyperthermia, the probe was sufficiently stiff that the mechanical stop was unnecessary. The mapper is able to rezero the probe by driving it into the end of the catheter to reestablish the zero cm point without damage to the probe or the catheter. A colored mark made on the probe is used in place of the clip on reference stop to allow verification of probe position. Dwell time needed to achieve 0.1 °C accuracy after a shift in probe position was determined by use of awater bath set 20 deqrees above ambient temperature with a catheter spanning both the water bath and ambient air. The temperature probe reached equilibration (±0.1 °C) when moved over this 20 degree gradient in 8-10 seconds.
Experimental and clinical experience have shown that
the catheter to probe friction is far less with the Luxtron fibre optic
temperature probes than with the BSD Bowman thermistor temperature probes.
The Luxtron probe also is stiffer, resisting compressive forces on insertion
better than the Bsn Bowman thermistor, thus reducing mechanical backlash.
When the friction between the probe and catheter is low, the backlash on
reversal of travel is far less than the 0.75 mm step resolution of the
mapping device. Because of its more suitable mechanical characteristics
and smaller diameter, the Luxtron MPM fibre optic probe has been the only
probe used for monitoring intra-catheter temperatures during microwave
treatments at superficial depths (<3 cm) for the past 1100 treatments
in our clinic. Excessive catheter friction or blocked catheters during
the treatment of superficially located tumors prevented the effective use
of this mapping device in less than 1% of over 1100 treatments during 3.5
years of use. A comparison of data taken by manual and automatic
mapping along the sarne subcutaneously placed catheter during a single
treatment showed virtually identical temperature profiles (figure
10). Set up time for connecting the mapper to the implanted catheter,
inserting the probe and setting the position marker is approximately 1.5-2
min.
3.2. Device 2 - Friction driven multiprobe mapping device
The first series of experiments determined the positional accuracy of the linear translations, the optimal number of samples per individual temperature reading, and the minimum dwell time needed to allow probes to re-establish a new state of local thermodynamic equilibrium following translation. All of the following tests except when specifically noted were performed utilizing Luxtron fibre optic thermometry probes.
Positional accuracy was determined by translating the probes random distances in both directions for 100 cyclest then measuring the positions and comparing them to the expected positions. In addition, the cumulative amount of misalignment relative to home position was monitored during subsequent use of the system for thermal mapping. The random translation experiments showed a cumulative error over 100 cycles of ± 5mm. No homing was performed during these various 100 cycle experiments. However, the automatic homing mechanism used during actual temperature mapping in a clinical or experimental setting increases the accuracy to ± 1 mm by eliminating the cumulative map to map error. This is more than adequate for our purposes, and within the limits mentioned in the literature(Cetas et al. 1978, Christensen 1979, 1983, Hand 1987, Shrivastava et al. 1988, Kapp et al. 1988).
Tests done using Teflon sheathed thermoconpie sensors as the mapped thermometry probes, however, revealed some inadequacies with this design for a positioning device. The coefficient of friction between the drive rollers and the probes (figure 2a) was not high enouqh to reliably position the Teflon sheathed probes. Attempts to increase the coefficient of friction by increasing the idler wheel compression on the probe changed the effective radius of curvature of the rubberized drive cylinder in a difficult to control manner. This caused different probes to have different linear translations for a given number of rotations of the drive roller. This friction drive problem was also noted if there was any differential friction between the different catheter channels when Luxtron MPM probes were used with this system. The eventual solution to the problem of retaining the probe sparing advantage of a friction driven system while simultaneously retaining high positional accuracy in the presence of variable probe to catheter friction required separating the position defining and probe translating functions into distinct hardware modules (Devices 3 and 4).
A temperature regulated water bath at 37.0 °C was used for the determination of the optimal number of samples per reading (a programmable parameter of the Luxtron 3000 fibre optic system). A mercury in glass thermometer (traceable to NBS standards) was used as a reference. Multiple BSD Bowman probes which in prior tests gave very stable readings in a constant temperature environment (Fessenden et al. 1984) were inserted in the water bath to automatically record any cyclic changes in the water bath teinperature. After the water temperature stabilized, the temperatures were sampled for several five minutes intervals, each time varying the number of samples per reading (10, 20, 40 and 80). The range, mean and standard deviation (S.D.) for all eight probes together were determined to choose the lowest nunber of samples per reading that gave temperatures with S.D. 0.1 °C (table 1). The optimal value which minimized the range and standard deviation and allowed for reasonable retrace time was 20 samples per point; 10 samples per point was too noisy, 40 and 80 samples took longer but did not give significantly better results. with 20 samples the total retrace time for a ten point map was on the order of 90 seconds. Most of this time is spent waiting for probe equilibration since increasing the sample number from 20 to 40 only increases total retrace time to 110 seconds. This retrace time is clearly inadequate in light of the requirement of a temporal resolution of 1 second (Cetas and Conner 1978, Christensen 1979, Christensen 1983, Hand 1987, Shrivastava et al. 1988, Kapp et al. 1988). However for near steady state systems, such as during a patient treatment after the initial ramp up (Christensen 1983), a mechanically scanned system can be used to complement existing stationary thermometry and intratumoral mapped thermometry when using large area applicators.
To determine the minimum dwell time needed to achieve thermal equilibrium following translation of a probe in a catheter, an experiment was designed to create a stable sharp temperature gradient along the mapped length of the catheters. The temperature gradient was created by a vinyl cylinder (0.006 cm wall thickness, 0.5 cm diameter, 20 cm long) set up to circulate temperature regulated hot water maintained at 10 °C above ambient temperature. This cylinder was placed with its long axis perpendicular to the scan path of the eight probes. The position of the vinyl cylinder was set such that one temperature reading was taken directly under the vinyl cylinder (10 °C above ambient temperature) with the preceding and subsequent readings taken in the ambient room temperature environment beyond the edge of the cylinder. The dwell time was varied from 1 to 15 seconds in 1 second increments to find the minimum dwell time necessary to allow for thermal equilibration. The two test criteria used for determining adequate dwell time were: 1) symmetry in the temperatures about the cylinder's central axis, 2) no change in the measured temperature profile with increasing dwell time. The experiments described revealed that symmetry in scanning was achieved with a dwell time of a seconds, with only minimal improvement at a dwell time of 10 seconds and no significant improvement beyond 10 seconds. The optimal dwell time of 8-10 seconds for the Luxtron 3000 probes inside Deseret catheters correlates well with observations in the literature (Waterman 1985) as well as with the simpler test used to evaluate Device 1. For our clinical and experimental studies, 6-8 time constants is considered necessary for thermal equilibrium to be achieved, with the time constant for a catheter enclosed Luxtron probe measured as ~1.6 seconds. This gives an estimated minimum settling time of 9.6 seconds, very near our measured values. It also agrees well with results reported by others (Shrivastava et al. 1988) assuming that the catheter increases the time constant of the thermometry by a factor of three (Waterman 1985).
The 2D-TMS was tested in a series of animal experiments performed to study the effect of blood flow rate on the 2D temperature distribution induced in the porcine kidney by uitrasound. The kidney of an anesthetized pig was instrumented with a flow meter to determine rate of inflow of blood. Eight 18 gauge interstitial stainless steel thermometry catheters were placed traversing the kidney. The 2D-TMS was used to scan fibre optic probes (Luxtron MPM probes) inserted within these steel catheters. The kidney was then heated using ultrasound (Freq.=2.040 MHz, diameter of transducer = 6.5 cm) at power levels between 50 and 150 acoustic watts. Blood flow was controlled by partial ligation of the renal artery. Multiple temperature distributions were obtained at each blood flow and power setting. The 2D-TMS acquired data was compared to the more limited manually mapped and recorded data. The 2D-TMS thermal profiles from the porcine kidney experiments were very similar to the manually acquired data but were much easier to acquire and permitted obtaining much more data. It was possible to obtain many more frames of data at any given perfusion and ultrasound power combination than with the manual method. This also allowed obtaining sufficient temperature information to establish the stability of the 2D temperature profile with time.
The 2D-TMS was also tested for use in the hyperthermia clinic on human patients as an adjunct to the standard stationary surface thermometry and scanned interstitial thermometry. The utility of surface temperatures has been discussed (Cetas 1978, 1980) with the conclusion that for superficial tumors, that the surface temperature is very important. This is especially true for chest wall recurrences in which the diseased tissue in many instances extends through to the skin. There is some evidence that surface temperatures may even reflect the temperatures in the deeper underlying tissues (Szmigielski and Bielic 1976).
The patients that were the subjects of these initial surface mapping experiments had large flat treatment reqions permitting the mapping sheet to be easily conformed to the skin surface contours. Standard thermometry was first set up; the stationary BSD Bowman and Luxtron probes were taped down on the skin surface and the catheter for the scanned intratumoral fibre optic probe(s) inserted. The mapping sheet was then laid over these probes. The scanning double spiral applicator (Samuiski et al. 1990) was utilized to induce local hyperthermia, and both mapped and stationary temperatures were recorded.
Clinical use confirmed that the long retrace time
made the mapped temperatures inadequate for use in making power control
decisions during the teinperature ramp-up portion of the treatment.
During this initial part of the treatment, the measured temperatures rises
from 0.5 to 1.5 °C per minute. A retrace time of 90 seconds
allows for up to a 0.75 to 2.25 °C unmonitored temperature rise.
Once therapeutic temperatures have been reached and the power is adjusted
to maintain a pseudo steady state condition, the temperature pattern recorded
by the mapping sheet correlated in general with the with fixed surface
thermometry. However there was an average offset of approximately
-0.7 °C between the readings of the stationary surface sensors and
those acquired by the surface mapping system. This offset was in the direction
of the applicator water bolus temperature. Since temperature probes
placed on the skin surface are influenced by both the temperature of the
skin and the temperature of the overlying water bolus, it is possible that
the amount of effective thermal averaging between the skin temperature
and the bolus temperature is different for a sensor within a surface catheter
and a sensor directly taped to the skin. This problem is currently
being further investigated. In certain cases hot areas felt by the
patient as painful but not detected by the relatively sparsely placed fixed
probes (between 12-19) were located with the scanning thermometry sheet.
This information permitted the power over those regions to be adjusted
with relief of patient pain and discomfort.
3.3. Device 3 - Friction driven multiprobe mapping device utilizing a rotating cylinder for positive probe positioning
Problems encountered with Device 2 when attempting to utilize it to map fibre optic temperature probes where the catheter to probe friction was high or variable, and the inability of Device 2 to reliably position Teflon sheathed thermocouple temperature sensors under even ideal conditions, necessitated the development of Device 3. Device 3 was constructed primarily to allow these low cost, flexible Teflon sheathed thermocouples to be used as mapped thermometry probes. The Teflon jacketed flexible thermocouples maintained calibration reliably enough and were sufficiently durable and inexpensive that a design which semipermanently incorporated the probes into the positioning device did not sacrifice thermometry system practicality or performance.
The rotating positive positioning cylinder around which these probes are wound has a diameter of 7.6 cm giving an effective probe travel of 21 cm taking into account the loss of effective radius by the mounting hardware. Position resolution of Device 3 is lijaited to 0.03 cm by the resolution of the stepper motor and the geornetry of the drive mechanics. A positioning resolution of 0.1-0.05 cm can be achieved in practice. Variable catheter friction with the resultant variable flexing of the feed tubes and catheter with respect to the contained probes are the performance degrading factors. Position repeatability is good to 0.05 cm. The maximum usable operating speed that does not result in loss of steps is 20 cm/sec.
This system was evaluated for long duration (30 hour) data acquisition experiments taking SAR data from metallic catheters placed within a solid ultrasound phantom. This application required a high order of accuracy in order to reconstruct the beam intensities from the local rate of temperature rises. The ultrasound near field can undergo a 50% change in intensity over 1 to 2 mm at the operating frequencies of the transducers. In order for the experiments to yield repeatable results, the mapping device had to be able to repeat positions to within 1 mm. During these tests, the system computer controlled the transducer power as well as the thermometry and probe positioning device in order to perform the SAR determinations without requiring human intervention. ( Figure 11 ) shows an example of the iso-SAR contours obtained from maps taken by this experimental set-up.
This device was also tested under the more demanding
conditions in a large animal (pig) where the operating conditions are less
controlled than on a lab bench. During these animal tests equipment
physical positioning is not fixed and spilled fluids which can change the
coefficients of friction in the mechanical drivers are common. It
was under these conditions that Device 2 tailed to give reliable positioning.
No problems or malfunctions were encountered during this 12 hour experiment.
( Figure 12 ) is an example of a 2-dimensional profile
acquired by this mapping device
3.4. Device 4 - Friction driven multiprobe mapping device utilizing linearly sliding platforms for positive positioning
This device, while mechanically constructed.to be
capable of positioning an array of thermometry probes, was implemented
to position single temperature sensors within the 36 cm long 16 gauge catheters
employed for thermometry during deep heating treatments in the clinic.
The compression force exerted on catheters inserted for deep heating by
the treatment set-up is far greater than for the catheters used for monitoring
superficial depth heating. As a consequence, a simple single roller
positioning device such as Device 1 would not be able to accurately control
the locations of the temperature sensors in their catheters. The
low operating frequency (60-100 MHz), high power and the resultant large
stray fields that the deep heating array (BSD SIGMA 60 system) generates
precludes placing a mapping device with electrical drive lines in close
proximity to the radiative aperture. The mapper must therefore be
able to be operated with an extension cable on the order of a meter long
to obtain the needed distance from the antenna array used to heat the patient.
This large spatial separation can degrade positioning accuracy if there
is catheter friction, by allowing the probe to bunch up within the probe
extension tube during move operations that push the probe into the catheter.
This problem can be minimized if all probe positioning is done by withdrawing
the probe from a more deeply inserted point to its intended position.
The probe type and catheter thickness is the same as that used in Devices
1 and 2 so the dwell time at each point is set at a minimum of 10 seconds.
The speed of movement the linear positioners are capable of is 0.3 cm/sec.
This platform is highly over geared and is speed limited by the drive speed
of the stepper motor controller. The spatial resolution given by
the linear translation per stepper motor is 0.0008 cm/step. This
is degraded by mechanical flexure of the probe and catheter such that when
the maximum pressure that still allows probe movement is applied to the
catheter, the difference in position between a probe moving in a friction
free state and a probe moving in this constricted catheter is 0.15 cm over
a ten cm long map. In approximately 30% of catheter insertion sites
mechanical mapping was not possible. This was due to the extreme
constriction of the catheter where it exited the patient caused either
by the weight of the patient or the weight of the applicator water bolus
resting on the catheter in a manner that prevented probe movement.
Since a four element fibre optic linear array is also available for thermometry
to obtain four separate points along the catheter it was decided not to
increase patient discomfort and increase the risk of insertion related
complications by utilizing a larger diameter stiffer catheter to attempt
to eliminate those instances where mechanical mapping is not possible.
4. DISCUSSION and CONCLUSIONS
Four different mechanical probe positioning devices with different design criteria were constructed and tested in laboratory and clinical settings. Device size and complexity, set-up time, accuracy, repeatability, and scan rate were factors that had to be balanced off against each other. The philosophy of design was to attempt to develop the smallest, simplest implementation that would accomplish the clinical or experimental task. None of these devices as they are described are mechanically optimized; operational testing has found points in all four devices where further improvements can be made. They have however adequately performed the specific tasks for which they were constructed.
The single probe positioning Devices 1 and 4 were designed for very different operating environments. The shallowly placed interstitial catheters inserted for thermometry during hyperthermia treatments of superficially located tumors usually have little to no friction between the inserted fibre optic probe and the catheter. The potential mobility of the patient around the probe insertion sites is high since the patient is not constrained by a wrap around annular applicator as is the case for deep heating treatments. Room for setting up equipment is at a premium due to the use of up to 25 power cables and their over head supports associated with the surface applicators, and up to 32 temperature sensors that may be placed on the skin surface and within inserted catheters (Lee et al. 1991). A miniature mapper which can be placed where there is available space in the set-up area and that was small and light enough to track patient movements was required.
The single probe mapper for the deep heating system had to be designed to operate at a distance far enough from the applicator to avoid interaction with the fields of the large low frequency applicators and be able to move probes contained within relatively constricted catheters. While the deep heating mapping unit can operate as single probe mapping devices for performing superficial treatments, it is neither size nor cost effective for this application. The specially made extended fibre optic probes needed to operate with the mapping unit's meter long catheter extension tubes also cost approximately three times more than standard fibre optic sensors.
The two dimensional mapping systems proved useful in both the laboratory and clinical setting. Their major strength is that they permit the acquisition of two dimensional pseudo isotherm images dynamically during animal experiments and clinical treatments. Much of this information is not obtainable with other systems. They present the data in a temperature versus two dimensional XY position format allowing the user to easily interpret the overall spatial temperature distribution. The positional display correlates with the positional power control displays controllinq the large area surface applicators currently used in the clinic, and makes it easier for the operator to appropriately adjust the power for a given area based on the latest measured temperatures. The one major problem with these systems is their slow retrace time which severely limits their usefulness for feedback power control. These systems can enhance thermornetry acquired by superficially located probes but can be used at depth only through the use of arrays of multiple interstitial catheters which is not clinically practical in most situations. There still remains a serious need for non-invasive three dimensional thermometry to overcome this limitation of the 2D-TMS.
Evaluating the mechanical drivers only, Device 2 which was the predecessor to Device 3 and Device 4 is considered unsatisfactory due to its inability to accurately position probes under any but carefully controlled mechanical conditions. Any differential friction between catheters or within a catheter over time caused variable amounts of mechanical slippage which. rendered positioning unpredictable. Device 2 was also incapable of accurately positioning arrays of Teflon sheathed temperature sensors even under ideal test conditions due to the very low coefficient of friction of Teflon. Both flevice a and Device 4 have been shown to be able to position temperature sensors under conditions of moderately high catheter probe friction. Device 3,. which utilizes a cylindrical positioner is more compact than Device 4. Device 4 which utilizes linear slides for position referencing allows probes to be more rapidly loaded and interchanged. Probe insertion lengths for monitoring hyperthermia treatments in our clinical experience have never exceed 20 cm so the physical dimensions of the linear slide or the diameter of the roller do not need to be made any larger or longer than the currently existing prototypes.
As mentioned earlier, though these devices operate adequately for the tasks they have been designed to performed, laboratory and clinical testing has suggested improvements that could be implemented in future versions.
Device 1 could have its stepper motor replaced with a higher resolution unit to obtain greater positioning accuracy. The idler wheel could be replaced with a rotary optical encoder to obtain feedback on the actual amount of motion the probe is executing so that corrections can be made for probe slippage.
Device 3 should be constructed such that the feed point from the positioning cylinder to the drive rollers is at a tangent to the positioning cylinder instead of being perpendicular to its center of rotation. This would eliminate the feed angle calibration corrections needed when the probe anchoring point faces the drive rollers near full probe extension. A microswitch end stop reference should be placed to trigger in the fully retracted position. This would enable the positioner to have an automatic reference point when mapping into short catheters where full extension of the probe to trigger the present microswitch reference is not possible. Independent reels for each temperature probe, each controlled by its own drive motor could potentially give this device independent probe positioning ability. This would also eliminate the time consuming probe loading problem that the present device has with its single long probe positioning cylinder.
Device 4 as mentioned previously is highly overgeared.
The combination of a 6.3 rotations/cm pitch lead screw and a 200 steps/rotation
stepper motor produced a move constant of 1,260 steps/cm. since stepper
motor torque is inversely proportional to speed, there is a practical upper
limit to the stepper motor speed in this system that will overcome the
mechanical friction in the lead screw assembly and slide. The system
functions adequately as constructed but a large increase in speed of positioning
is possible if a coarser lead screw is substituted.
REFERNCES
Bowman, R.R., 1976, A probe for measuring temperature in radiofrequency-heated
material. IEEE Transactions in Microwave Theory and Techniques,
MTT-24, 43-45.
Cetas, T.C., Connor, W.G., 1978, Thermometry considerations in localized hyperthermia. Medical Physics, 5(2), 79-91.
Cetas, T.C., Connor, W.G., Manning, M.R.., 1980, Monitoring of tissue temperature during hyperthermia therapy. Annals of the New York Academy of Sciences, 335, 281-97.
Christensen, D.A., 1979, Thermal dosimetry and temperature measurements. Cancer Research, 39, 2325-2327.
Christensen, D.A., 1983, Thermometry and thermography. Hyperthermia in cancer Therapy, edited by F.K. Storm (Boston, G.K. Hall Medical Publishers), pp. 223-232.
Engler, M.J., Dewhirst, M.W.,.Winget, J.M., Oleson, J.R., 1987, Automated temperature scanning for hyperthermia treatment monitoring. International Journal of Radiation Oncology, Biology and physics, 13(9), 1377-1382.
Fessenden, P., Lee, E.R., Samulski, T.V., 1984, Direct temperature measurement. Cancer Research, 44(suppl). 4799s-4804s.
Fessenden, P., Lee, E.R., Kapp, D.S., Tarczy-Hornoch, P., Prionas, S.D., Sullivan, D.M., Samulski, T.V., Wilsey, T.R., McEuen, A.H., Tanabe, E., 1988, Improved microwave (MW) applicators for surface hyperthermia. Hyperthermic Oncology 1988, Volume 1. Summary Papers. Proceedings of the 5th International Symposium on Hyperthermia Oncology Kyoto. Japan 29 August- 3 september 1988, edited by Tsutomu Sugahara and Musao Saito, (London, Philadelphia: Taylor & Frances), pp. 773-774
Gibbs, F.A.Jr., 1983, "Thermal mapping" in experimental cancer treatment with hyperthermia: description and use of a semiautomatic system. International Journal of Radiation Oncology Biology and Physics, 9(7), 1057-1063.
Hand, J.W., 1987, Heat delivery and thermometry in clinical hyperthermia. Recent Results in Cancer Research, 104, pp 1-23.
Kapp, D.S., Fessenden, P., Samulski, T.V., Bagshaw, M.A., Cox, R.S., Lee, E.R., Lohrbach, A.W., Meyer, J.L., Prionas, S.D., 1988, Stanford University institutional report. Phase I evaluation of equipment for hyperthermia treatment of cancer. International Journal of Hyperthermia, 4(1), 75-115.
Kopecky, W.J., 1980, Using liquid dielectrics to obtain spatial thermal distributions. Medical Physics, 7(5). 566-70.
Lee, E.R., Tarazy-Hornoch, P., Fessenden, P., Kapp, D.S., Prionas, S.D.,1988, Scanning dipole antenna array applicator. Abstracts of Papers for the 8th Annual Meeting of the North America Hyperthermia Group. philadeinhia. Pennsylvania. 1988, p. 15
Lee, E.R., Wilsey, T., Tarczy-Hornoch, P., Kapp D.S., Fessenden, P., Lohrbach, A.W., Prionas, S.D., Body conformable 915 MHz microstrip arrays for large surface area hyperthermia. IEEE Transactions on Biomedical Engineering, Submitted 1991.
Lyons, B.E., Samulski, T.V., Britt, R.H., 1985, Temperature measurements in high thermal gradients: I. The effects of conduction. International Journal of Radiation Oncology. Biology and Physics, 11(5), 951-962.
Oleson, J.P., Dewhirst, M.W., Duncan, I., Engler, M., Thrall, D., 1985, Temperature gradients: prognostic and dosimetric implications. Proceedings of the 7th Annual Conference of the IEEE Engineering in Medicine and Biology Society. Frontiers of Engineering and Computing in Health Care - 1985, edited by J.C. Lin, B.N. Feinberg (NY, IEEE), pp. 355-360.
Plancot, H., Prevost, B., Chive, M., Fabre, J.J., Ledee, R., Giaux, G., 1987, A new method for thermal dosimetry in microwave hyperthermia using microwave radiometry for temperature control. International Journal of Hyperthermia, 3(1), 9-19.
Prionas, S.D., Hahn, G.M., 1985, Noninvasive thermometry using multiple-frequency-band radiometry: a feasibility study. Bioelectromagnetics, 6(4), 391-404.
Roemer R.B., Fletcher A.M., Cetas T.C., 1985, Obtaining local SAR and blood perfusion data from temperature measurements: steady state and transient techniques compared, International Journal of Radiation Oncology. Biology and Physics, 11, 1539-1550.
Samulski, T.V., Lyons, B.E., Britt, R.H., 1985, Temperature measurements in high thermal gradients: II. Analysis of conduction effects. International Journal of Radiation Oncology. Biology and Physics, 11(5). 963-971.
Samulski T.V., Fessenden P., Lee E.R., Kapp D.S., Tanabe E., and McEuen A., 1990, Spiral microstrip hyperthermia applicators: technical design and clinical performance, International Journal of Radiation Oncology. Biology and Physics, 18(1), pp. 232-242.
Shrivastava, P.N., Saylor, T.K., Matloubieh, A.Y., Paliwal, B.R., 1988, Hyperthermia thermometry evaluation: criteria and guidelines. International Journal of Radiation Oncology Biology and Physics, 14(2), 327-335.
Szmigielski, S., Bielic, M., 1976, Proc. Int.. Symp. Cancer Therapy by Hyperthermia and Radiation, edited by J.E. Robinson and M.J. Wizenberg (American College of Radiology, Bethesda, MD), p. 219.
Tanaka, H., Eno, K., Kato, H., Ishida, T., 1981, Possible application of non-invasive thermometry for hyperthermia using NMR. Nippon-Igaku-Hoshasen-Gakkai-Zasshi, 41(9). 897-899.
Waterman, F.M., 1985, The response of thermometer probes inserted into
catheters. Medical Physics, 12(3), 368-372.
FIGURE CAPTIONS:
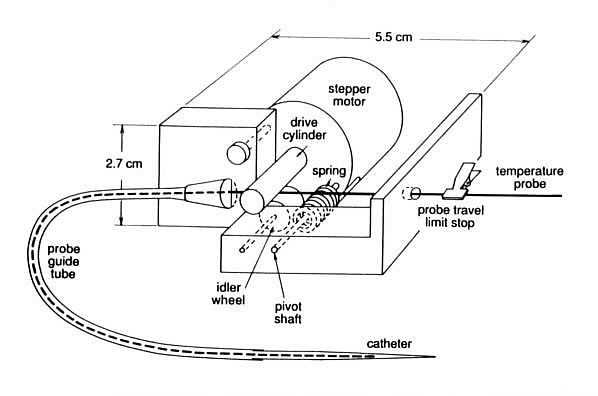
Figure 1(a) - Functional diagram of Device 1, (single probe
mapping unit for use during superficial depth hyperthermia treatments).
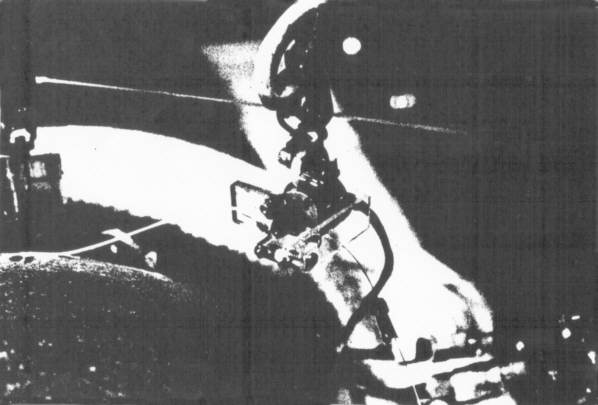
Figure 1(b) - Photograph of Device 1 in place during a patient
treatment.
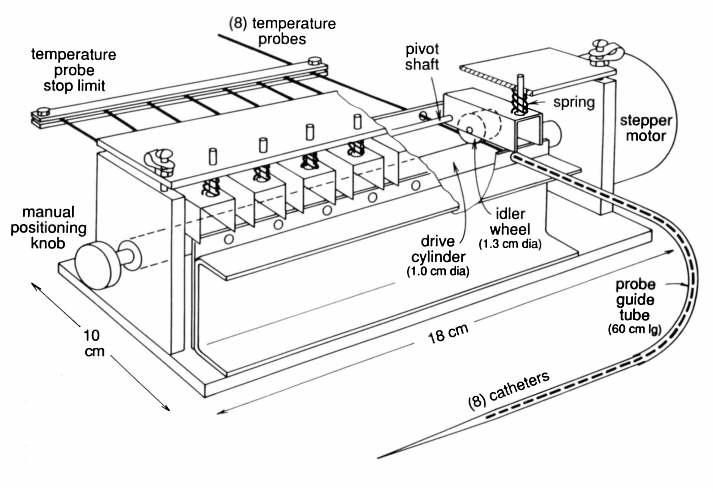
Figure 2(a) - Functional diagram of Device 2, (prototype multiprobe
mapping device).
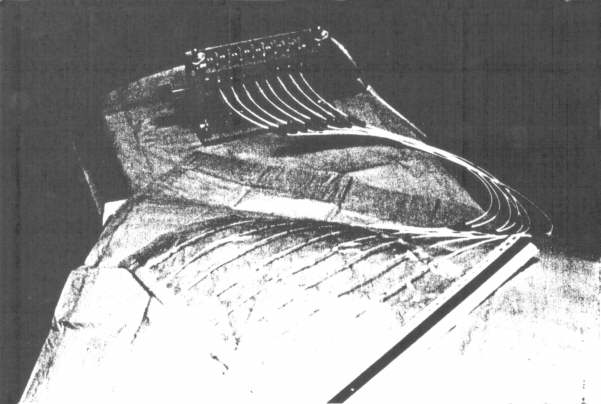
Figure 2(b) - Photograph of Device 2 connected to an eight catheter
array mapping sheet.
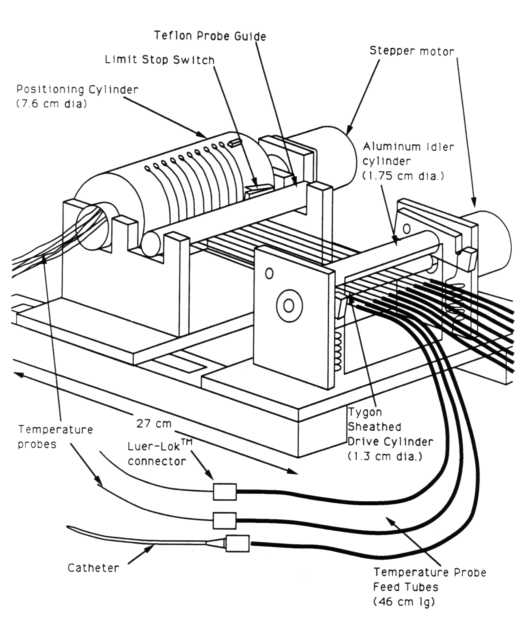
Figure 3(a) - Functional diagram of Device 3, (multiprobe mapping
device utilizing a rotary position defining cylinder).
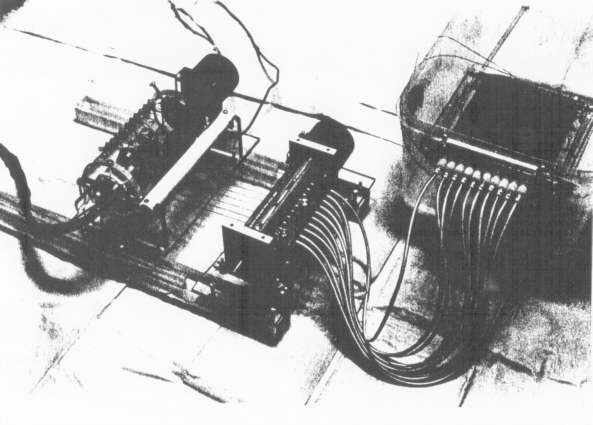
Figure 3(b) - Photograph of Device 3 connected to an ultrasound
phantom.
Additional and better images of this device
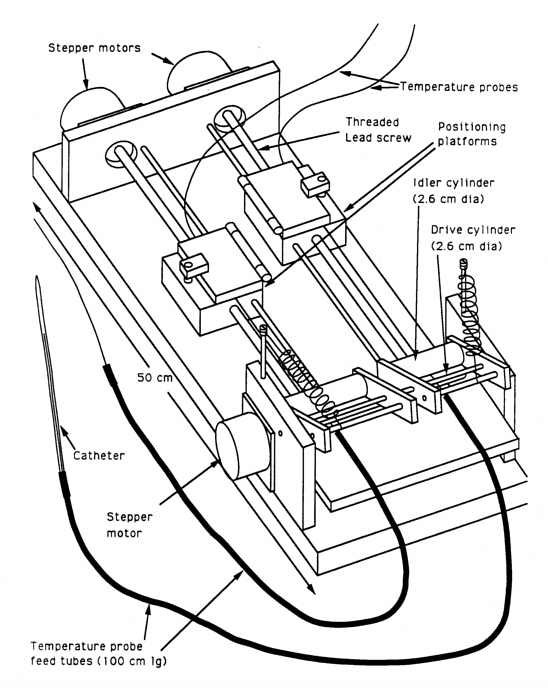
Figure 4(a) - Functional diagram of Device 4, (single/multiprobe
mapping device utilizing position defining linear slides).
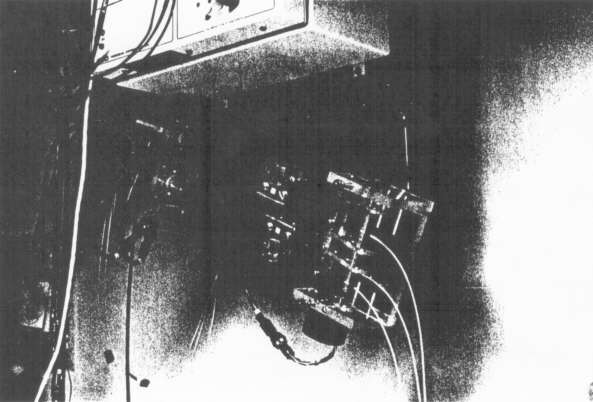
Figure 4(b) - Photograph of Device 4 mounted on the BSD SIGMA
60 overhead thermometry rack.
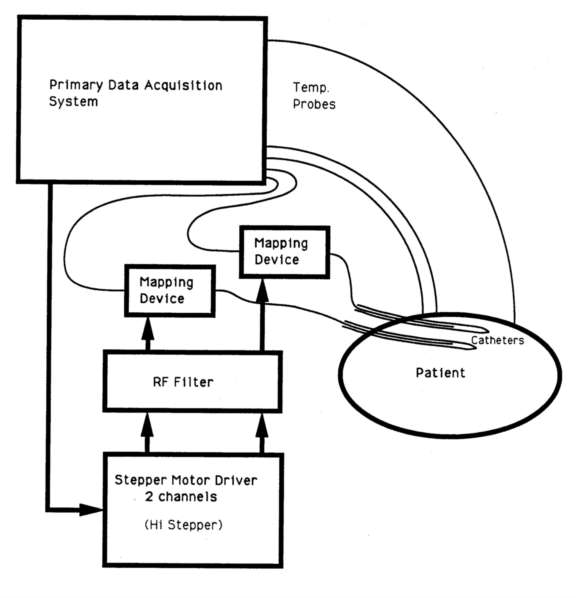
Figure 5 - System block diagram for Device 1 (single probe positioning
unit for superficial depth treatments).
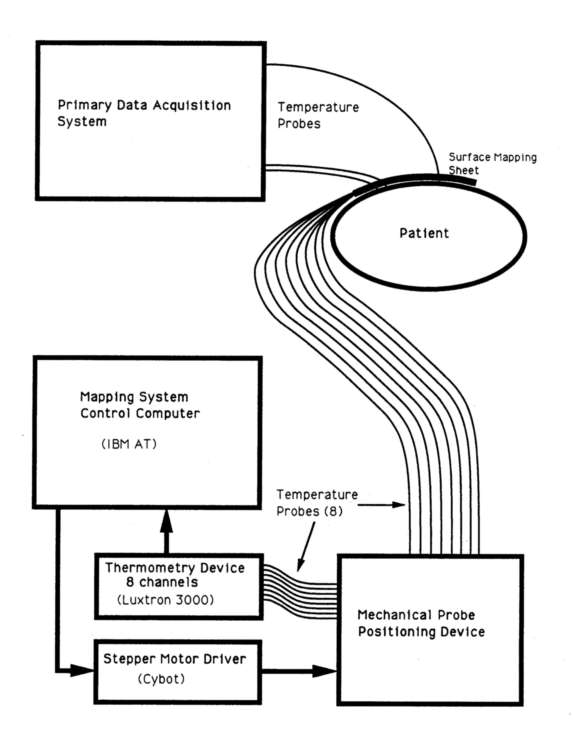
Figure 6 - System block diagram for Device 2 (multi-probe positioning
unit).
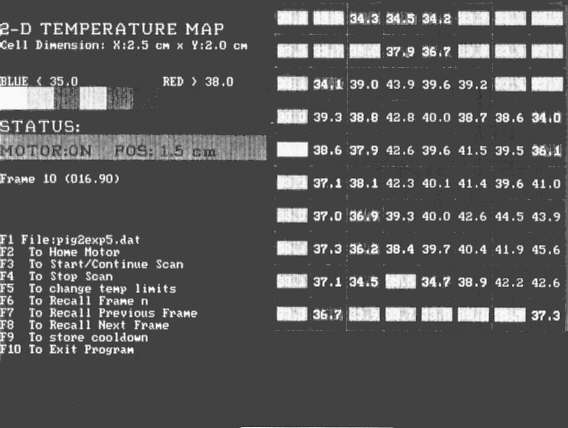
Figure 7 - Two dimensional color coded operator display for
Device 2 (translated to gray tones for publication).
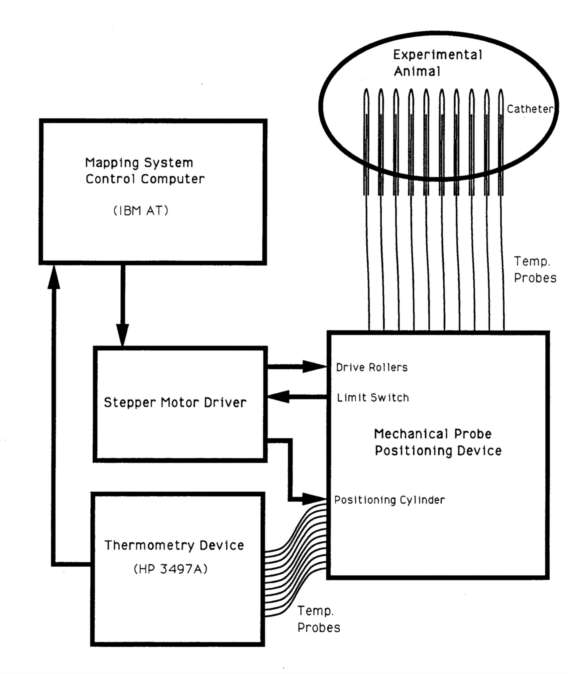
Figure 8 - System block diagram for Device 3 (multi-probe positioning
unit utilizing a rotary position defining cylinder).
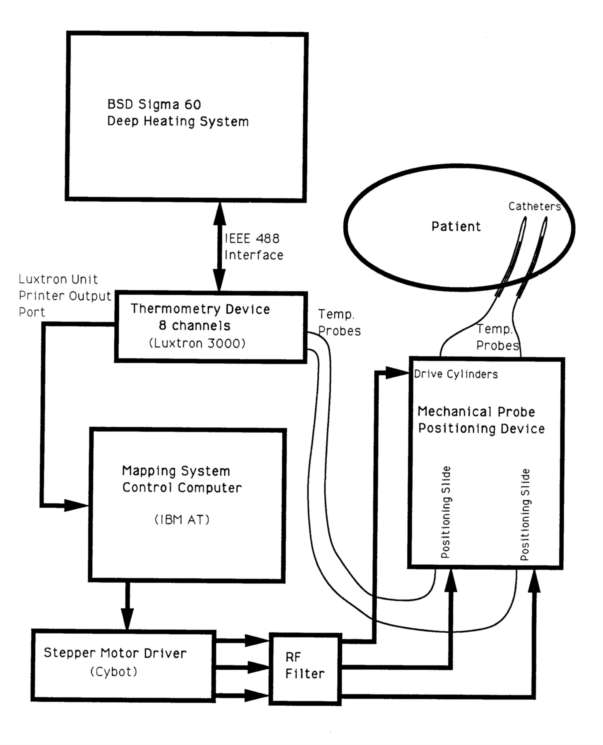
Figure 9 - system block diagram for Device 4 (single/multiprobe
positioning unit utilizing linear slides).
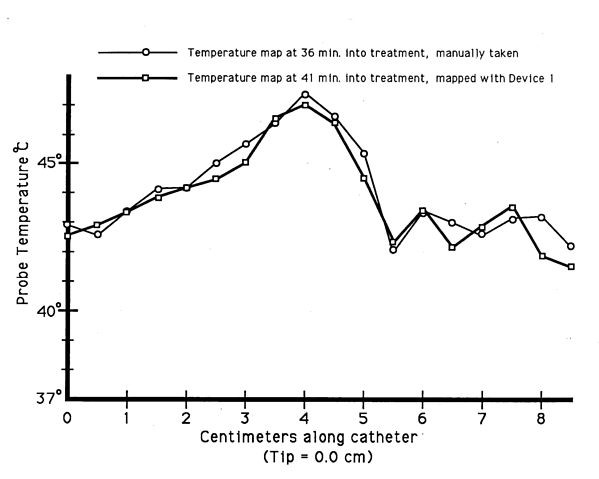
Figure 10 - Comparison of automatically obtained mapped temperature
data utilizing Device 1, and mapped temperature data obtained by manually
positioning and recording the intracatheter temperature probe.
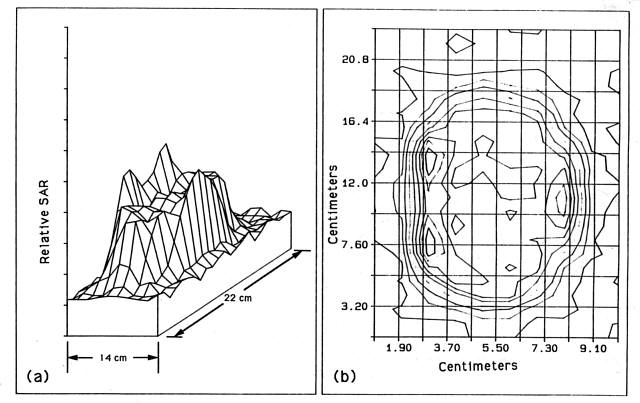
Figure 11 - SAR plot taken by Device 3 of a 6.5 cm diameter,
2.040 MHz transducer in a tissue equivalent solid phantom. Iso-SAR lines
( figure (b)) are plotted at ten percent intervals.
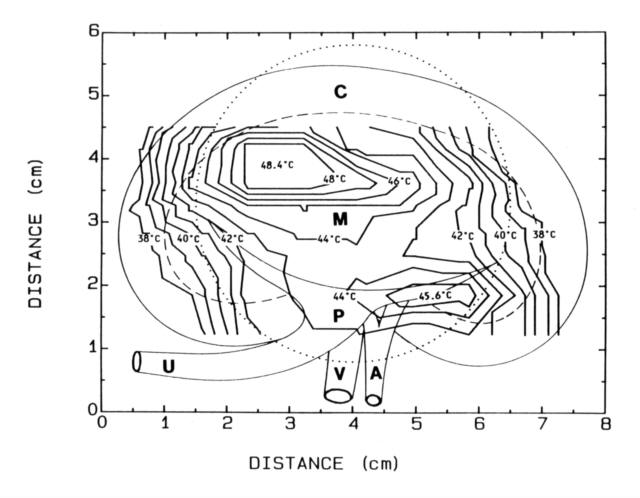
Figure 12 - Isothermal lines generated from a mapped array of
ten interstitial probes mapped by Device 3 during an in vivo heating experiment
in a pig kidney. Anatomical features are superimposed.
(A = renal artery, C = renal cortex, M =
medulla, P = renal pyramid, V = renal vein).
TABLE CAPTIONS:
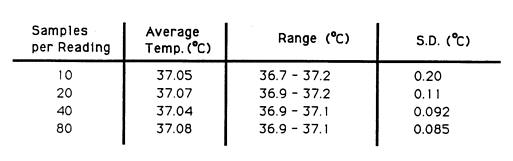
Table 1 - Temperature accuracy and precision versus samples
per reading for the Luxtron 3000 fibre optic thermometry system. The temperature
probes were placed in a temperature regulated water bath at 37.0 °C